Bear Flag Pattern Explained: How to Identify and Trade It in a Downtrend
The bear flag pattern is one of the most popular indicators for technical analysis. It helps traders determine whether a downtrend will continue, and can be great for markets like crypto or stocks.
Because of this, understanding how to identify them is important for investors, especially users of the Atomic Wallet.
What is a Bear Flag Pattern?
As established earlier, the bear flag pattern is a bearish continuation pattern. It is mostly used to identify a pause in an ongoing downtrend before prices continue falling.
It tends to form after a sharp price drop, which is known as the "flagpole."
When the flagpole fully forms, the price starts to consolidate within a small, upward-sloping channel (or the flag).
This consolidation phase shows profit-taking behaviour among investors, or a small counter-trend rally before the bears take control once again, and drag prices lower.
When it comes to making decisions using this pattern, traders carefully watch price action for a breakout below the flag's support line. They can then use this to determine whether the downtrend has resumed or not.
Trading Bear Flags with Atomic Wallet
For crypto traders using Atomic Wallet, identifying bear flag patterns becomes particularly valuable when managing your digital asset portfolio. The wallet's built-in exchange features allow you to quickly execute trades when bear flag breakouts occur.
When you spot a bear flag forming on cryptocurrencies available in your Atomic Wallet portfolio, you can use the wallet's instant exchange feature to convert holdings before the anticipated price decline continues. This is especially useful for major cryptocurrencies like Bitcoin, Ethereum, and other altcoins supported by the platform.
The key advantage of using Atomic Wallet for bear flag trading is the ability to maintain full control of your private keys while having immediate access to trading opportunities, without needing to transfer funds to centralized exchanges.
Bull Flag Pattern vs Bear Flag Pattern
Understanding the difference between the bull flag pattern vs bear flag pattern is very important for any technical trader.
While both of them are continuation patterns, they are still very different when it comes to interpretation, the market sentiment they represent and the trend direction that follows.
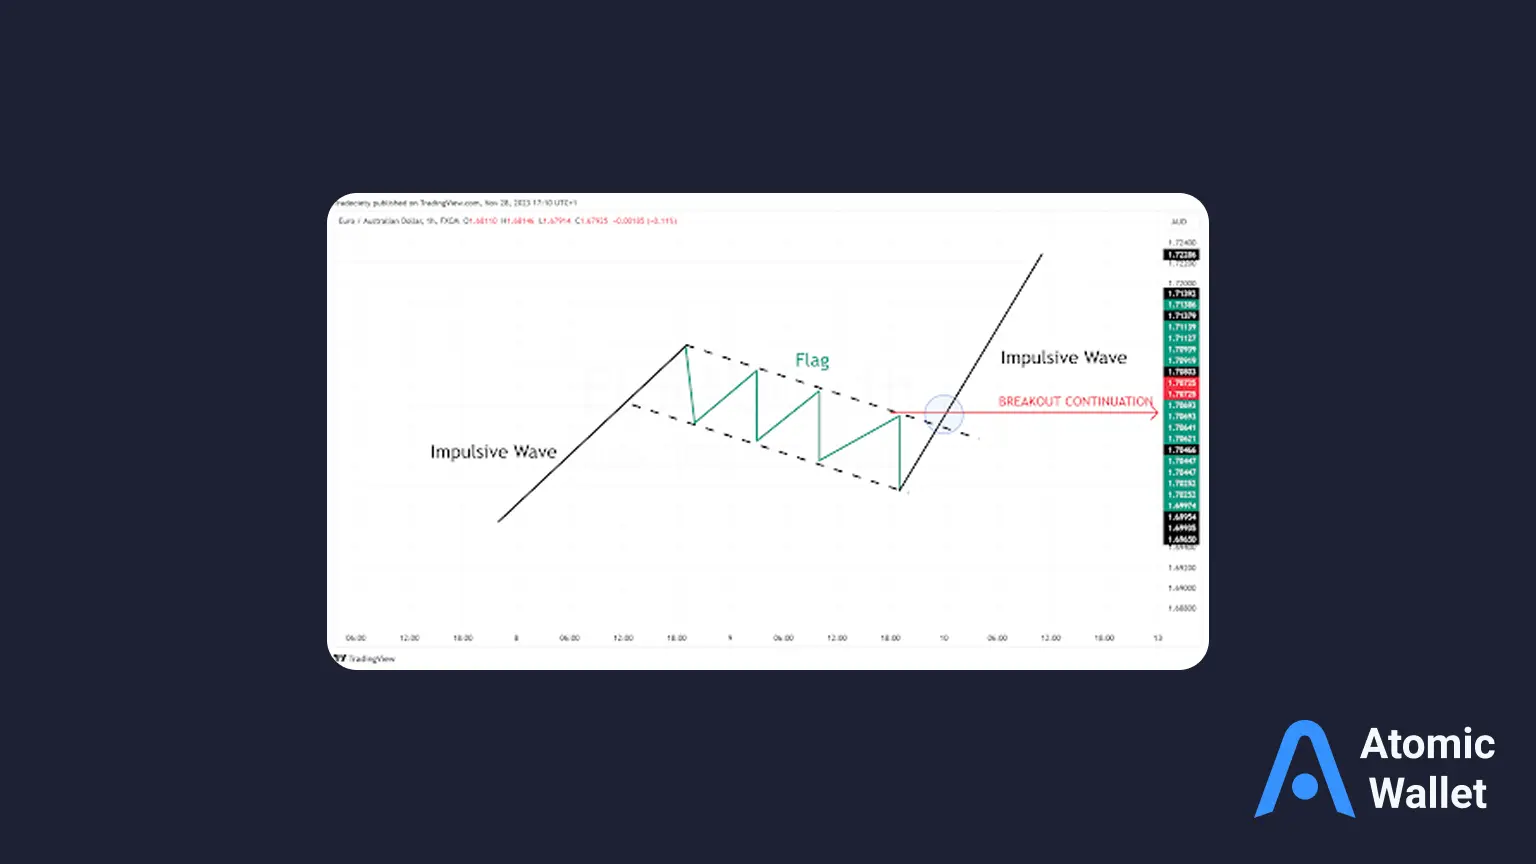
The bull flag pattern (as its name signifies), is a bullish continuation pattern that shows up during an uptrend.
It is formed when prices shoot upwards and form the flagpole, before consolidating downwards and forming the flag.
When this pattern shows up, it indicates that the bulls have taken a pause in buying activity. It also means that buyers who were previously sidelined, or missed their entries have a chance to jump in before the uptrend continues.
On the other hand, the bear flag pattern is a bearish continuation signal that tends to show up during a downtrend.
It tends to include a sharp downward move (the flagpole as mentioned), followed by an upward-sloping or horizontal consolidation (the flag).
The main difference between both lies in the flagpole, as well as the direction of the consolidation channel that follows.
A bull flag's consolidation moves against the uptrend, while a bear flag's consolidation moves against the downtrend.
Visually, bull flags will have higher lows and higher highs within their flag structure, while bear flags have lower highs and lower lows within their flag during a downtrend.
In essence, recognizing these patterns and understanding the market sentiment for each is a very important part of any trader’s job.
Bear Flag Trading Pattern Explained
The bear flag trading pattern can be a very reliable way to study market psychology.
Right after a massive price decline (the flagpole), exhausted sellers might take a temporary break, or short-term buyers might step in.
This pattern of behaviour between the bulls and bears leads to a period of consolidation, which is the flag.
The trend of lower trading volume compared to the initial sharp decline, indicates a small battle between buyers and sellers. Understanding volume analysis is crucial for confirming bear flag patterns.
Within a bear flag, buyers are attempting to push the price higher. However, their efforts are being met with continued selling pressure from the dominant downtrend.
When this happens, the price forms a channel that tends to slope slightly upwards, against the direction of the downtrend.
This counter-trend movement can trick inexperienced traders into believing that a reversal is happening.
However, for those familiar with the bear flag pattern, this consolidation is recognized as merely a pullback within the main downtrend.
The underlying psychology shows that while some profit-taking or short-covering occurs, the dominant bearish sentiment is still very much alive.
Traders then keep a watch out for a breakdown below the flag's support line, alongside an increase in selling volume.
When both of these signs occur together, it shows that the original downtrend is coming back into play.
This breakdown often triggers new selling pressure, as both original sellers re-enter the market and new sellers join in with the hopes of further price declines.
Bear Flag Stock Pattern: How to Identify It
Identifying a bear flag stock pattern requires quite some experience with specific technical signals.
Firstly, look for any signs of a strong downtrend (which is the "flagpole.")
What you’re looking for should be strong and relatively steep. After identifying this trend, look for signs of a consolidation where the price moves within a visible channel.
This channel should generally be sloping gently upwards, opposite the main downtrend.
To confirm the pattern, traders can use various chart tools and indicators including trendlines, volumes, moving averages and more.
To use Trendlines, Draw parallel trendlines connecting the highs and lows of the consolidation phase.
These lines define the "flag" channel and if it is clean/well-defined, this could be a sign that it is valid.
In addition to this, pay close attention to volume.
The flagpole should have high trading volume, which shows strong selling pressure.
The consolidation within the flag, however, should see a noticeable decrease in volume that shows a temporary pause in the trend.
When a breakout from the flag does happen, confirm the downtrend by looking for a massive surge in selling volume.
Finally, be aware that prices within the flag tend to trade below important moving averages (like the 20-period, 50-period etc).
Entry Strategies & Trade Management
Entering a trade based on the bear flag pattern requires patience and confirmation.
Without these, profits will remain low, and risks will remain high. The best entry points typically occur when the price breaks below the lower trendline of the flag pattern.
This breakdown should ideally be followed by a massive increase in trading volume.
Some aggressive traders might consider waiting for a retest of the broken trendline. However, this carries a much higher risk.
Some confirmation signals to look for include a spike in volume as mentioned, alongside a visible increase in selling volume upon the breakout.
Breakouts also tend to come alongside a strong bearish candlestick pattern, like a large bearish engulfing candle, which closes underneath the flag's support. Learning to read candlestick patterns effectively can significantly improve your bear flag trading accuracy.
Overall, knowing how to manage open trades when the market is being volatile, can be a very important skill.
Once an entry is made, it is important to monitor the trade closely. If the price re-enters the flag pattern after a false breakout, it might be a signal to exit altogether.
On the other hand, if the downtrend accelerates as expected, traders might consider trailing their stop loss to lock in profits.
Implementing Bear Flag Strategies in Atomic Wallet
Atomic Wallet's comprehensive cryptocurrency support makes it an ideal platform for implementing bear flag trading strategies across multiple digital assets. Here's how to effectively use the wallet for bear flag trading:
Portfolio Monitoring: Use Atomic Wallet's portfolio overview to track multiple cryptocurrencies simultaneously, allowing you to identify bear flag patterns across different assets in your holdings.
Quick Execution: When a bear flag breakout occurs, Atomic Wallet's built-in exchange enables rapid position adjustments without the delays associated with transferring funds between platforms.
Risk Distribution: The wallet supports over 500 cryptocurrencies, allowing traders to spread bear flag strategies across various assets, reducing concentration risk in any single cryptocurrency.
Secure Trading: Unlike centralized exchanges, Atomic Wallet ensures you maintain control of your private keys throughout the trading process, providing enhanced security for your bear flag trading activities.
Risk Management: Stop Loss & Profit Target
Great risk management is important for trading the bear flag pattern, or any trading strategy.
To reduce the chances of loss in case the pattern fails to behave as expected, knowing how to place a well-calculated stop loss is very important.
The best way to place a stop loss is typically just above the upper trendline of the flag.
This makes sire that if the price unexpectedly reverses and breaks above the flag, your loss is limited.
On the other hand, a better approach to this issue would be to place the stop loss above the high of the flagpole.
It is important to note though, that this move creates a wider risk exposure.
Calculating a realistic take-profit target is also important for success as a trader.
The most common method for setting a profit target with a bear flag is to measure the height of the "flagpole" (the initial sharp price drop) and project this distance downwards from the point of the breakout from the flag.
For instance, if the flagpole measured $100 and the breakout occurred at $500, a reasonable target would be $400.
This method is based on the idea that the downtrend that comes after the flag will be at least as strong as the initial decline.
Consideration of the risk-to-reward ratio is also important to note before entering any trade.
A great risk-to-reward ratio is typically 1:2 or higher (which means that on every trade, you should look to gain at least twice what you risk).
For example, if your stop loss has a possible loss of $50, your profit target should aim for a gain of $100 or more.
This makes sure that even with a win rate of less than 50%, you can still be profitable in the long run.
Examples & Charts (Crypto & Stocks)
To illustrate the bear flag pattern, let's consider an example in the Bitcoin market.
Consider Bitcoin’s price performance between 8 November 2021 and 25 June 2022.
This scenario covers the peak of the last bull market around $69,000 to its eventual crash towards $20,000 by mid-2022.
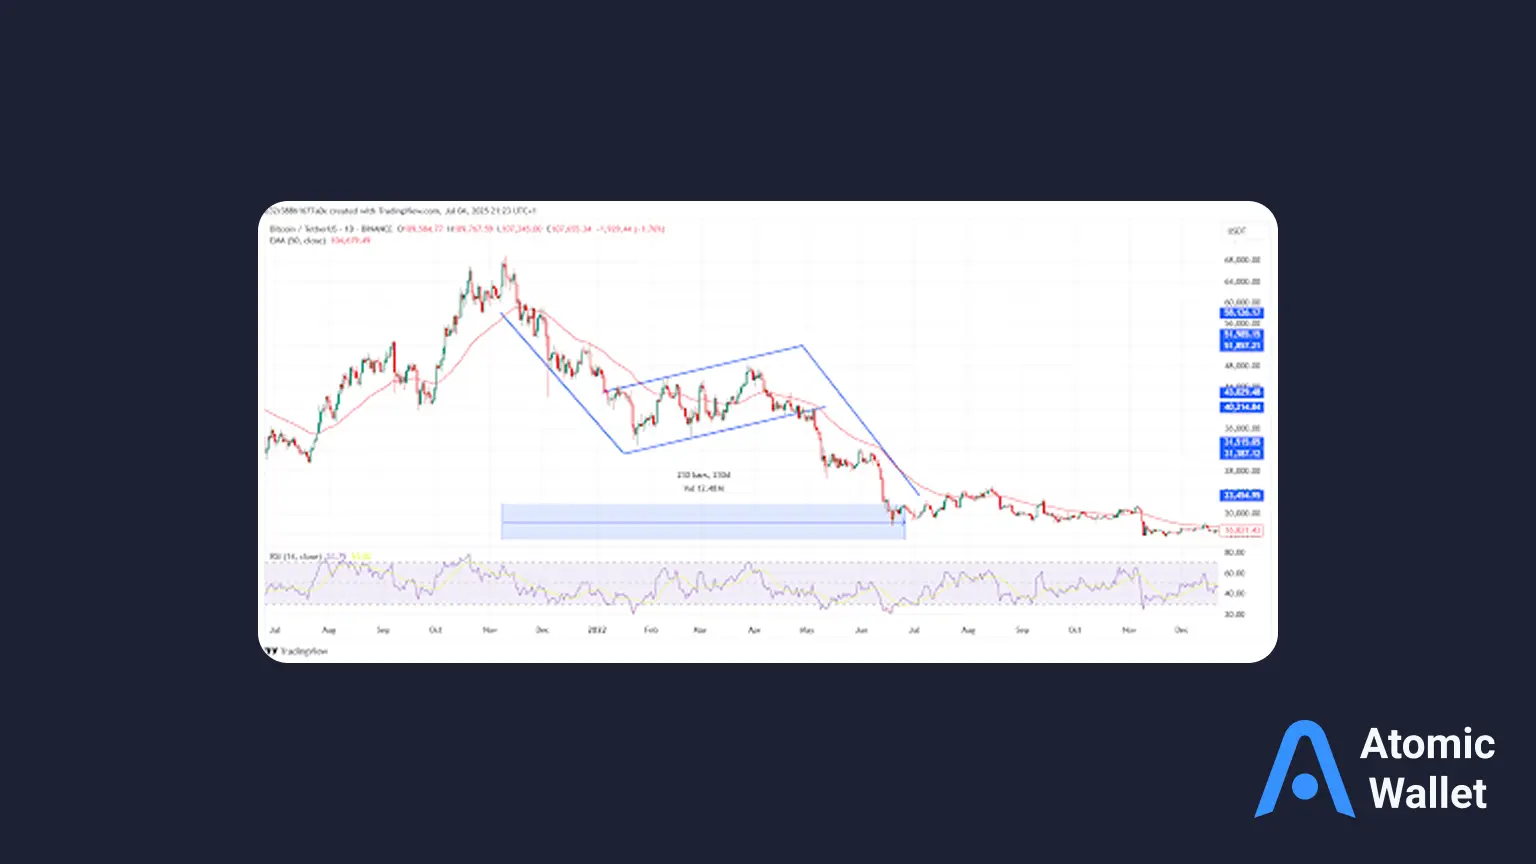
Bitcoin, after hitting a high of $69,000 in November of 2021, experienced a sharp sell-off to $17,990 by 20 June of the next year, forming a clear flagpole.
Right after the initial drop from $69,000 to $32,800, the cryptocurrency consolidated upwards and even hit a high of $48,150:
All before resuming its downtrend and eventually hitting $17,990.
During this consolidation, trading volume was noticeably lower than during the initial drop.
The same pattern played out with the US dollar Index ($DXY) 13% crash between March 2020 and January 2021.
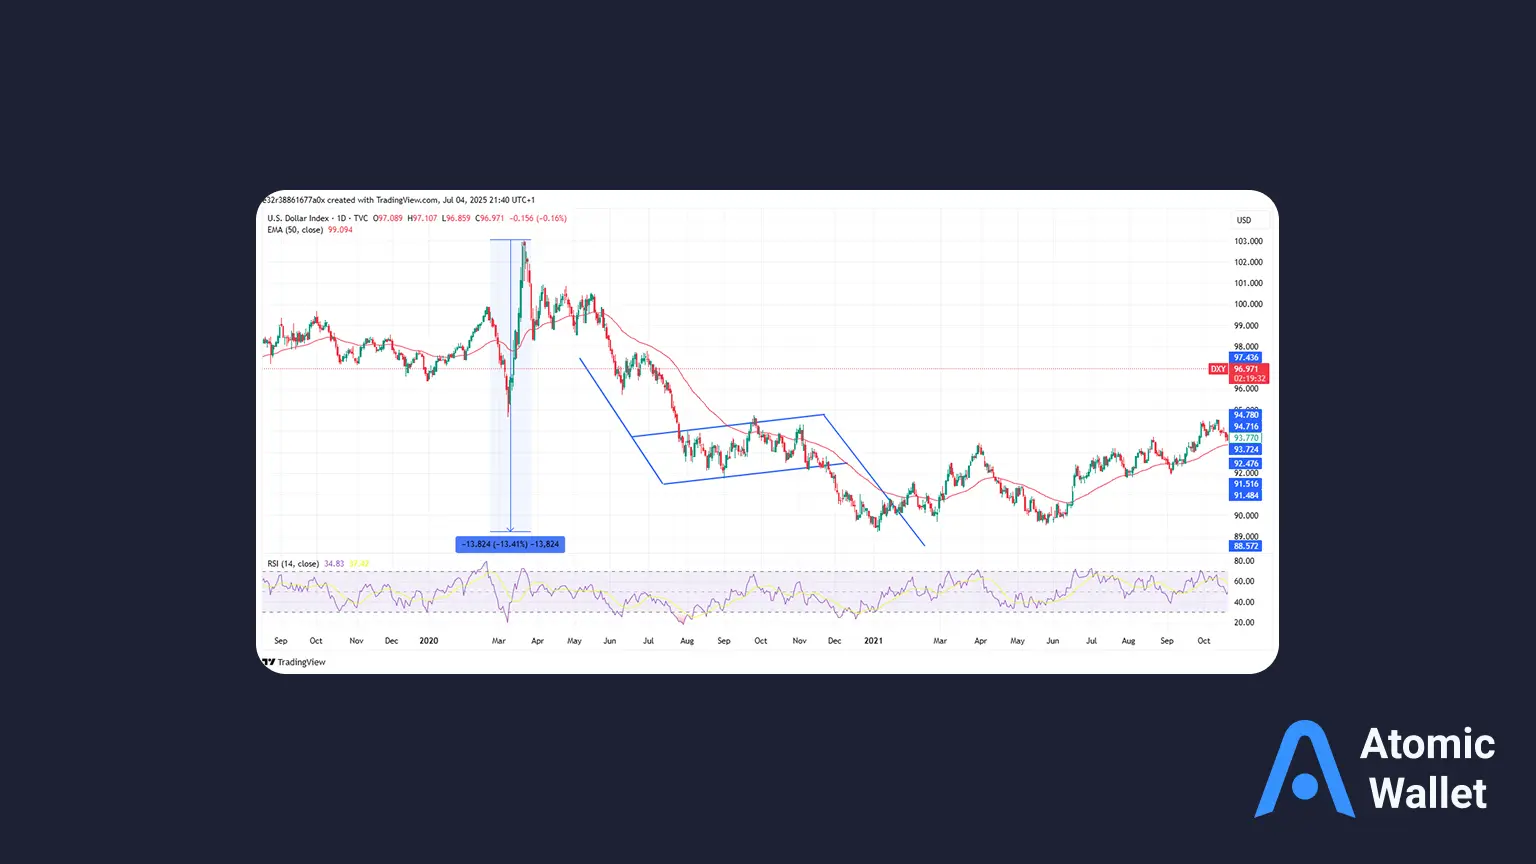
The Index crashed from a high of 103 to 91, before consolidating further upwards and being rejected around 100 once again.
The resulting crash led the index straight downwards to 89 nearly a year after.
Pros, Cons & Failure Cases
While the bear flag pattern is a powerful tool, it comes with its own set of advantages, disadvantages and failure scenarios.
Benefits of trading the bear flag pattern
For starters, bear flags have a high probability of continuation. When they are confirmed, bear flags offer a relatively high probability of the initial downtrend continuing.
They also have relatively clear entry points (breakout below the flag), stop-loss placements (above the flag's resistance) and profit targets compared to other patterns.
Risks and why false breakouts happen
One of the biggest risks of bear flags is "false breakouts." False breakouts occur where the price briefly drops below the flag's support, only to quickly reverse and move back into or above the flag.
This can lead to premature entries and losses, and false breakouts tend to occur either from insufficient volume confirmation or market manipulation.
Importance of confirmation and volume signals:
Confirmation is a very important part of entering, taking profits and exiting trades.
Always wait for a clear breakdown below the flag’s support, alongside a strong increase in selling volume. Proper technical analysis requires patience and confirmation signals.
Remember that volume acts as a "truth serum" for price action, where a high volume breakout shows strong conviction.
FAQ Section
What is a bear flag trading pattern?
A bear flag trading pattern is a bearish continuation chart pattern that forms during a downtrend.
It forms after strong downward price movement (the flagpole) followed by a period of upward-sloping or horizontal consolidation (the flag).
How is it different from a pennant?
While both bear flags and pennants are continuation patterns, their consolidation phases can be different.
A bear flag's consolidation typically forms a rectangular or slightly upward-sloping channel.
On the other hand, a pennant forms a symmetrical triangle where both the upper and lower trendlines converge.
Can the pattern fail?
Yes, the bear flag pattern can fail. Failures tend to happen when the price, instead of breaking down, unexpectedly breaks above the flag's upper trendline.
This shows that a trend reversal could either be incoming, or a stronger-than-expected counter-trend rally.
How long does it typically last?
Bear flag patterns can vary in length. However, the consolidation phase (the flag) is relatively short-lived (a few days to a couple of weeks).
A prolonged consolidation period might show a loss of bearish momentum and a higher chance of pattern failure.
Conclusion & CTA
The bear flag pattern is a very powerful tool for traders looking for high-probability setups during a downtrend, whether trading traditional stocks or cryptocurrencies through platforms like Atomic Wallet.
Understanding what makes bear flags different and combining it with confirmation signals like volume can help traders improve their skills massively. For cryptocurrency enthusiasts, Atomic Wallet's comprehensive features provide the perfect environment to implement these strategies while maintaining full control over your digital assets.
While the pattern has some of the clearest entry, stop-loss and profit-taking points, there are still real risks of false breakouts. During your trading journey, remember that successful trading depends on discipline.
Be sure to apply these indicators while keeping the risks in mind. This means that you should always start with small positions and continually refine your strategy. Consider exploring Atomic Wallet's features to enhance your cryptocurrency trading capabilities.
Plan your trades well and stay ahead of the curve in the crypto and stock markets.