Dogecoin Technical Analysis: Deep Dive

Dogecoin has consistently been a focal point in the cryptocurrency market, especially during times of heightened volatility. Rapid price fluctuations, viral social media trends, and recurring Dogecoin headlines frequently thrust DOGE into the spotlight, making dogecoin technical analysis a popular search topic. Created by Billy Markus and Jackson Palmer as a fork of Litecoin in December 2013, Dogecoin was designed as a fun and approachable cryptocurrency to attract users beyond the core Bitcoin community.
It is widely used as a tipping currency on platforms like Twitter and Reddit, fostering strong community engagement. The Dogecoin community, along with influential supporters active on Twitter, has played a crucial role in maintaining its relevance and value. For further details and community interaction, the official Dogecoin website is a valuable resource. Considering annual trends and the current year is important when evaluating Dogecoin’s price performance and market behavior, as its volatility and speculative nature often mirror broader shifts in market sentiment.
Grasping dogecoin technical analysis enables traders and investors to understand how Dogecoin’s price reacts to supply and demand dynamics, market psychology, and overall conditions in the crypto market. Based on the popular ‘doge’ meme and featuring a Shiba Inu in its logo, Dogecoin’s development features are less advanced compared to other cryptocurrencies, but its community-driven spirit remains a key element of its appeal. Instead of relying on speculation, technical analysis provides a systematic approach to examining historical price data, trading activity, and recurring market patterns. For those managing DOGE alongside other digital assets, using a secure self-custodial option like a dedicated Dogecoin wallet is often recommended to interact safely within the ecosystem.
This article is intended for educational purposes only and does not constitute financial advice. Always conduct your own research (DYOR) and consult multiple sources before making any decisions regarding Dogecoin or other cryptocurrencies.
Fundamentals of Dogecoin Price Charts
Price Charts and Candlestick Structure
At the core of dogecoin technical analysis is the price chart, which visually tracks how Dogecoin’s price evolves over time and serves as the primary tool for spotting trends, momentum shifts, and recurring price patterns. Among the various types of charts, candlestick charts are the most popular because they offer detailed insights into market behavior within specific timeframes.
Each candlestick represents four essential data points: opening price, closing price, highest price, and lowest price. When examined sequentially, candlesticks reveal how buying and selling pressure changes over time. While line charts are simpler and highlight broader price direction, they lack the detail needed for more advanced analysis.
Timeframes and Market Perspective
Timeframes are crucial for interpreting Dogecoin’s price behavior. Short-term charts showcase intraday volatility and rapid price changes, whereas daily and weekly charts provide a clearer view of longer-term market trends. Analyzing multiple timeframes together gives a more comprehensive understanding of market movements and short-term fluctuations.
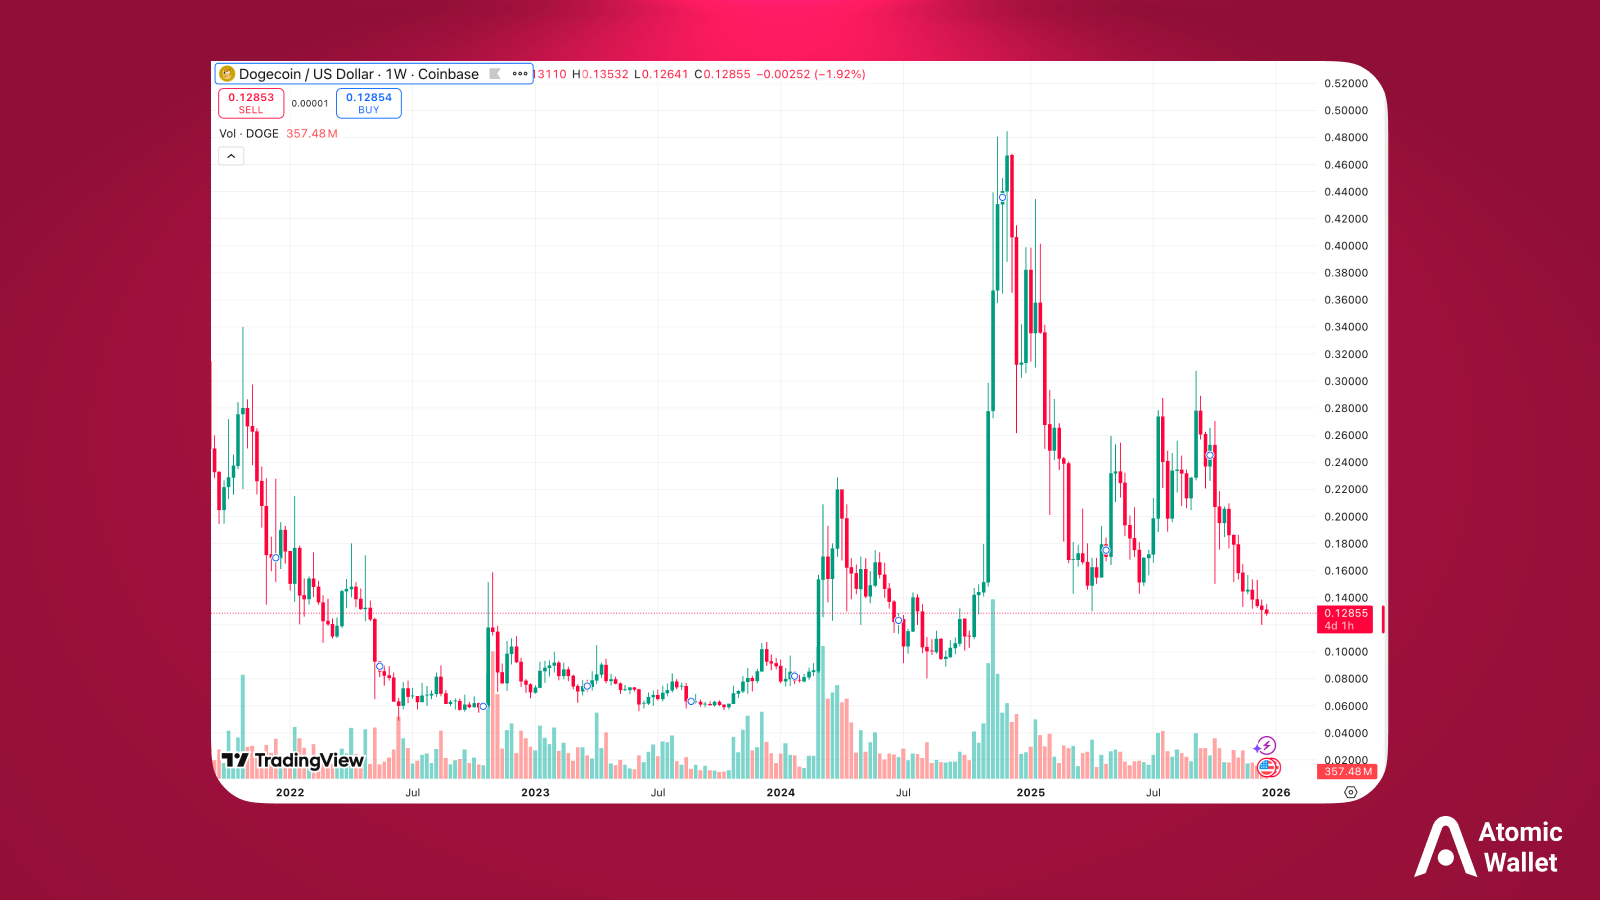
Recent analysis shows that Dogecoin’s price has been highly volatile, currently trading between $0.13 and $0.29 with bearish signals. Historically, Dogecoin has demonstrated pronounced volatility during broader market downturns and sentiment-driven cycles.
For example, throughout 2024–2025, Dogecoin experienced multiple sharp corrections following periods of speculative enthusiasm. During these phases, DOGE frequently retraced more than 50–60% from local highs, reflecting its sensitivity to market sentiment and liquidity conditions rather than fundamental network developments. In late 2025, Dogecoin traded significantly below several previously established support zones, including the $0.14–$0.15 range, which historically acted as a consolidation area. The loss of these levels highlighted persistent bearish pressure across higher timeframes. At the same time, historical data shows that Dogecoin has repeatedly formed compression patterns - such as falling wedges - after extended declines, occasionally preceding counter-trend rallies when broader market conditions improved.
From a historical perspective, key price zones between $0.12 and $0.13 have acted as accumulation or stabilization areas during periods of heightened fear, while resistance has consistently emerged near prior breakdown levels. Fibonacci retracement levels, particularly around $0.138, have historically served as inflection points where momentum either recovered or failed, depending on volume and market participation.
Overall, Dogecoin’s historical price behavior illustrates a recurring pattern: strong sentiment-driven expansions followed by deep retracements, emphasizing the importance of contextual and long-term technical analysis rather than short-term performance metrics.
Commonly Used Indicators
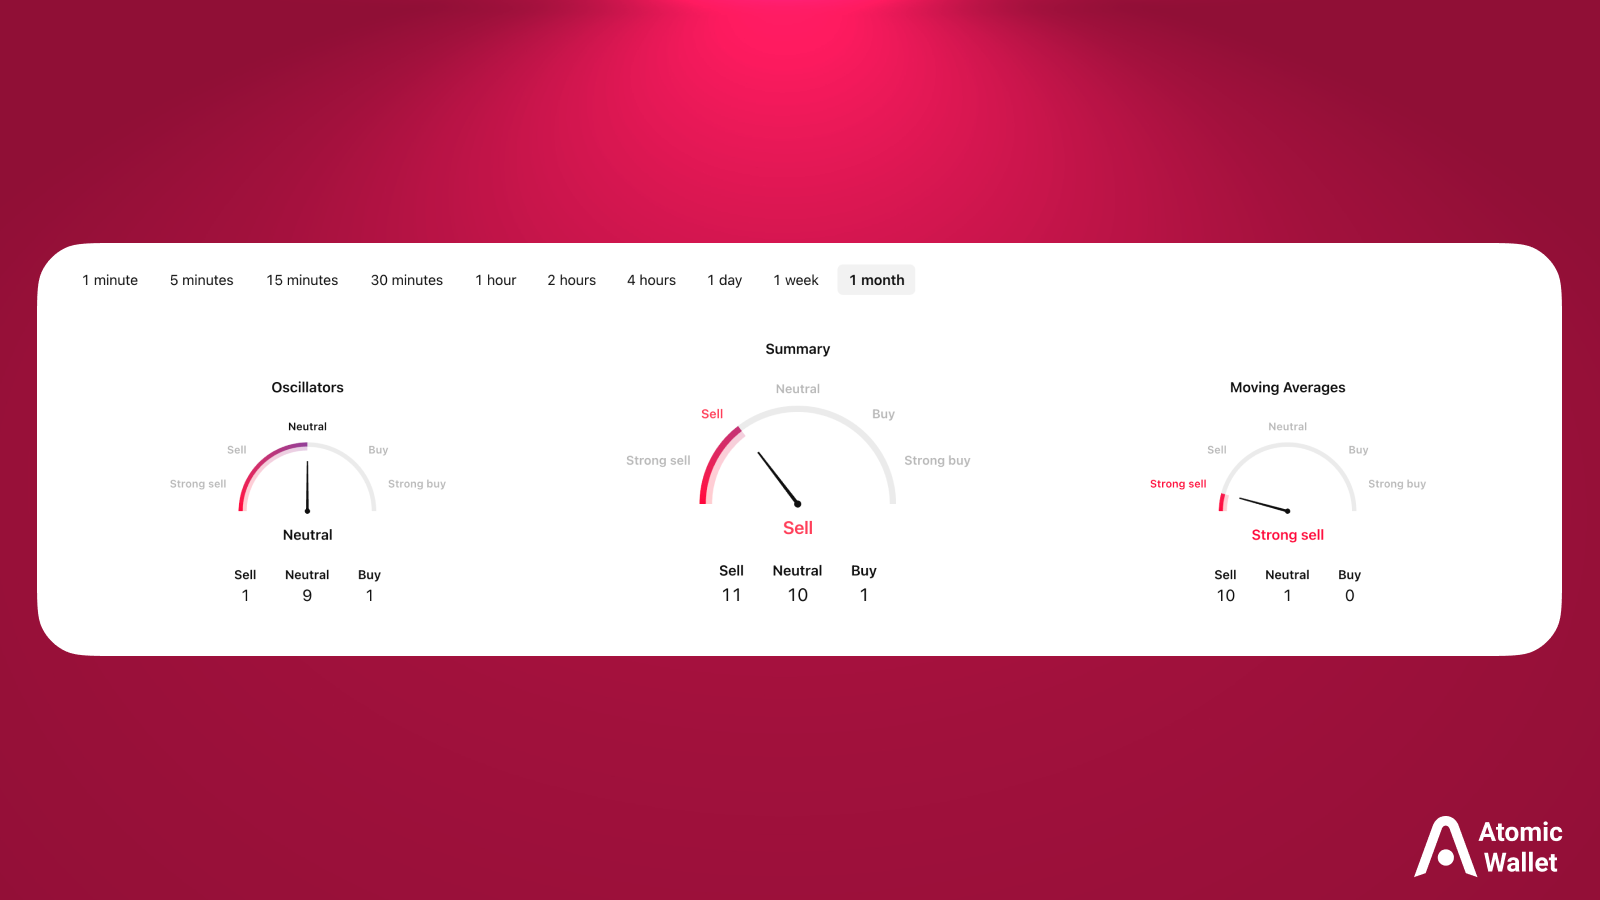
Technical indicators are frequently applied to price charts to deepen analysis. These indicators use mathematical formulas based on past price and volume data. In dogecoin technical analysis, indicators are generally divided into trend-following and momentum-based categories. Most indicators across timeframes currently signal a ‘Sell’ for DOGE, reflecting ongoing selling pressure. The Moving Average Convergence Divergence (MACD) remains bearish, signaling negative momentum, while the daily Relative Strength Index (RSI) is below 50, indicating weak market sentiment. Although the short-term outlook is bearish, there is potential for a bullish reversal if key levels are regained.
Using these indicators together helps reduce noise and enhances understanding of price movements.
Decoding Technical Indicators
To trade Dogecoin effectively in its fast-moving market, understanding technical indicators is essential. These tools help traders analyze market cap, trading volume, and price data to predict possible price movements. By using these tools, traders can identify trends, spot buying or selling opportunities, and develop strategies aligned with their investment goals.
Moving averages are among the most popular indicators, smoothing out price data to reveal underlying trends. For instance, when Dogecoin’s price crosses above its moving average, it may signal a buying opportunity; conversely, a drop below can suggest selling. Momentum indicators like RSI help determine if Dogecoin is overbought or oversold. An oversold RSI may suggest a rebound, while an overbought reading warns of a potential correction.
Trading volume and market capitalization are also key metrics. High volume often confirms strong price moves and market interest. Monitoring these helps traders gauge liquidity and volatility, especially during news-driven or highly active periods.
Elon Musk, Tesla CEO, is closely associated with Dogecoin’s market behavior. His tweets and public comments frequently trigger surges in trading volume and price swings, highlighting the importance of monitoring both technical indicators and external factors. While such events create opportunities, they also emphasize the need for disciplined trading.
The Motley Fool’s analysts often recommend focusing on long-term strategies targeting assets with potential to produce monster returns over time. While Dogecoin’s volatility may attract short-term traders, investors should evaluate whether DOGE fits within their broader portfolio and risk profile. Historically, Dogecoin has reached a highest price of $0.48750 USD and a lowest price of $0.04908 USD, underscoring the value of technical indicators in navigating its price swings.
Ultimately, successful Dogecoin trading depends on understanding technical indicators, having a clear strategy, and ongoing research. Combining technical analysis with fundamental insights and staying attuned to market trends enables more informed decisions - whether buying, selling, or holding Dogecoin. Always remember to do your own research, consult diverse sources, and invest only what you can afford to lose.
Support, Resistance, and Critical Price Levels
Support and resistance are fundamental concepts in dogecoin technical analysis. Support refers to price levels where buying interest tends to emerge, slowing declines. Resistance marks price points where selling pressure increases, limiting upward movement.
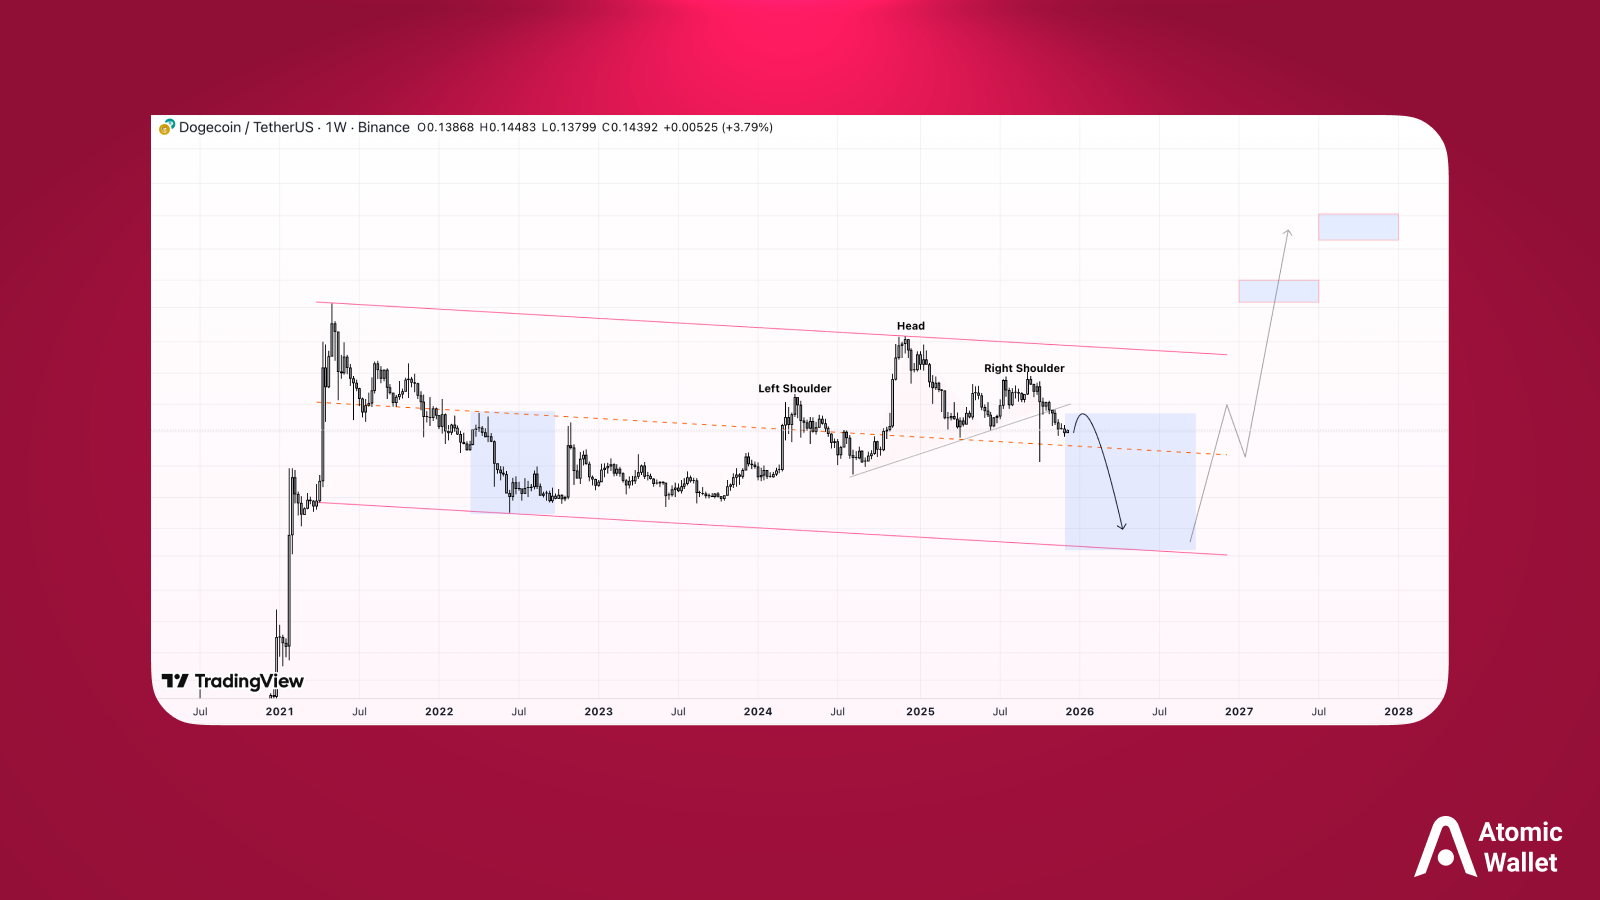
Dogecoin’s all-time high remains a key reference, with current resistance and support levels well below that peak, reflecting the significant decline.Dogecoin has historically shown bearish momentum when trading below the $0.145 support level, with market structure weakening under the $0.140 area. Resistance has tended to form around $0.142–$0.145, while support has repeatedly been identified within the $0.125–$0.132 range. The $0.138 Fibonacci level has often acted as a critical threshold, where sustained price acceptance on higher timeframes has coincided with momentum shifts. The $0.130 area remains a key structural zone, as repeated failures to hold this level have historically increased the likelihood of deeper declines toward $0.125. Additionally, a falling wedge pattern suggests a possible bullish breakout if validated.
These levels are dynamic zones shaped by past price action, volume, and trader behavior. Support and resistance often form around previous highs and lows, consolidation areas, and psychologically significant round numbers.
Given Dogecoin’s strong retail presence, emotional responses and sentiment shifts often reinforce these zones. Renewed Dogecoin news can prompt price to revisit these levels as market participants reassess conditions. Observing price reactions near support and resistance helps analysts determine if the market is trending, consolidating, or uncertain.
It is important to note that support and resistance analysis does not predict future outcomes but offers insight into historical market behavior and underlying price structure.
Role of Trading Data in Analysis
While price charts provide the visual foundation, trading data adds essential context. Metrics like trading volume, liquidity, and market depth explain the strength behind price moves. In dogecoin technical analysis, volume is especially important due to DOGE’s tendency for rapid, sentiment-driven price spikes.
Volume measures the total Dogecoin traded over a period. Price moves accompanied by high volume often indicate strong market participation, while moves on low volume may suggest weak conviction. Liquidity affects how easily DOGE can be traded without impacting price, and market depth reflects the balance of buy and sell orders.
Dogecoin news often interacts with trading data. Broad market events, social media narratives, or ecosystem updates can accelerate existing technical trends. News doesn’t replace technical analysis but helps explain sudden spikes in volume or volatility.
For users managing multiple cryptocurrencies, combining analysis with practical tools like Atomic Wallet supports a structured, non-speculative approach to crypto management.
Tailoring Analysis to Trader Profiles
Dogecoin attracts diverse market participants who apply technical analysis differently. Short-term traders focus on momentum, volume, and intraday price action, while longer-term analysts emphasize trend structure and historical price zones. Due to its high volatility, holding Dogecoin long-term can be challenging. Investing in DOGE is often seen as speculative compared to holding quality stocks or alternative assets. Dogecoin is not widely used for peer-to-peer payments and has limited utility in decentralized finance (DeFi). Its value largely depends on community interest, which appears to be waning. With an uncapped supply adding five billion new tokens annually, sustaining meaningful price appreciation is structurally difficult.
These factors explain why dogecoin buy opinions vary widely. A significant short-term price move may be minor within a broader trend. Understanding these perspectives helps clarify market commentary and reduces confusion from conflicting views.
Effective dogecoin technical analysis combines multiple indicators with market context, including crypto-wide trends and sentiment.
Psychological Factors and Risk Assessment
Market psychology significantly influences Dogecoin’s price. As a socially driven asset, DOGE is sensitive to sentiment shifts, hype cycles, and emotional responses. Fear of missing out (FOMO) and rapid mood changes have historically caused sharp price swings.
Experts often recommend focusing on assets with stronger fundamentals and developer activity, noting Dogecoin’s limited long-term prospects compared to established cryptocurrencies. Dogecoin’s developer activity is low, with only 23 full-time developers, ranking 81st among the top 100 cryptocurrencies, which is uninspiring relative to others.
Recognizing psychological patterns aids analysts in interpreting volatility more objectively. Technical analysis encourages structured observation of sentiment through price and volume rather than emotional reactions.
Risk modeling complements this by evaluating how markets behave under various conditions. Instead of forecasting outcomes, analysts assess volatility, drawdowns, and scenario-based behaviors to understand historical price dynamics.
These concepts promote disciplined analysis and preparedness in volatile markets.
FINAL THOUGHTS
Dogecoin technical analysis offers a structured way to interpret how Dogecoin’s price responds to market forces, trading data, and psychological factors. By examining charts, indicators, support/resistance levels, and news impacts, analysts can better understand market behavior without relying on speculation.
As with any crypto asset, ongoing education and independent research are vital. Resources and secure tools like Atomic Wallet and its dedicated Dogecoin wallet help users responsibly explore the crypto space while maintaining full control over their assets.