What Is Altcoin Season? How to Spot It with Key Crypto Indexes

Crypto folks keep an eye on those times when everything but Bitcoin starts stealing the show. Money flows away from BTC, pumping up stuff like ETH, SOL or even wild meme coins. If you're looking to spread your bets, getting in early during a bull run can pay off big.
We'll break down what it means, look at past examples, and check out tools like the Altcoin Season Index and dominance charts. I'll explain how to read things like market shares, sentiment gauges, and price bands. This is all based on where things stand today, with practical tips on jumping in. Whether you're new to this or a pro, these tricks help navigate the shifts and catch when alts take the lead.
Introduction
Ever notice how the spotlight swings from Bitcoin to the rest of the pack? That's altcoin season in a nutshell. We'll cover the basics and some real-world cases here.
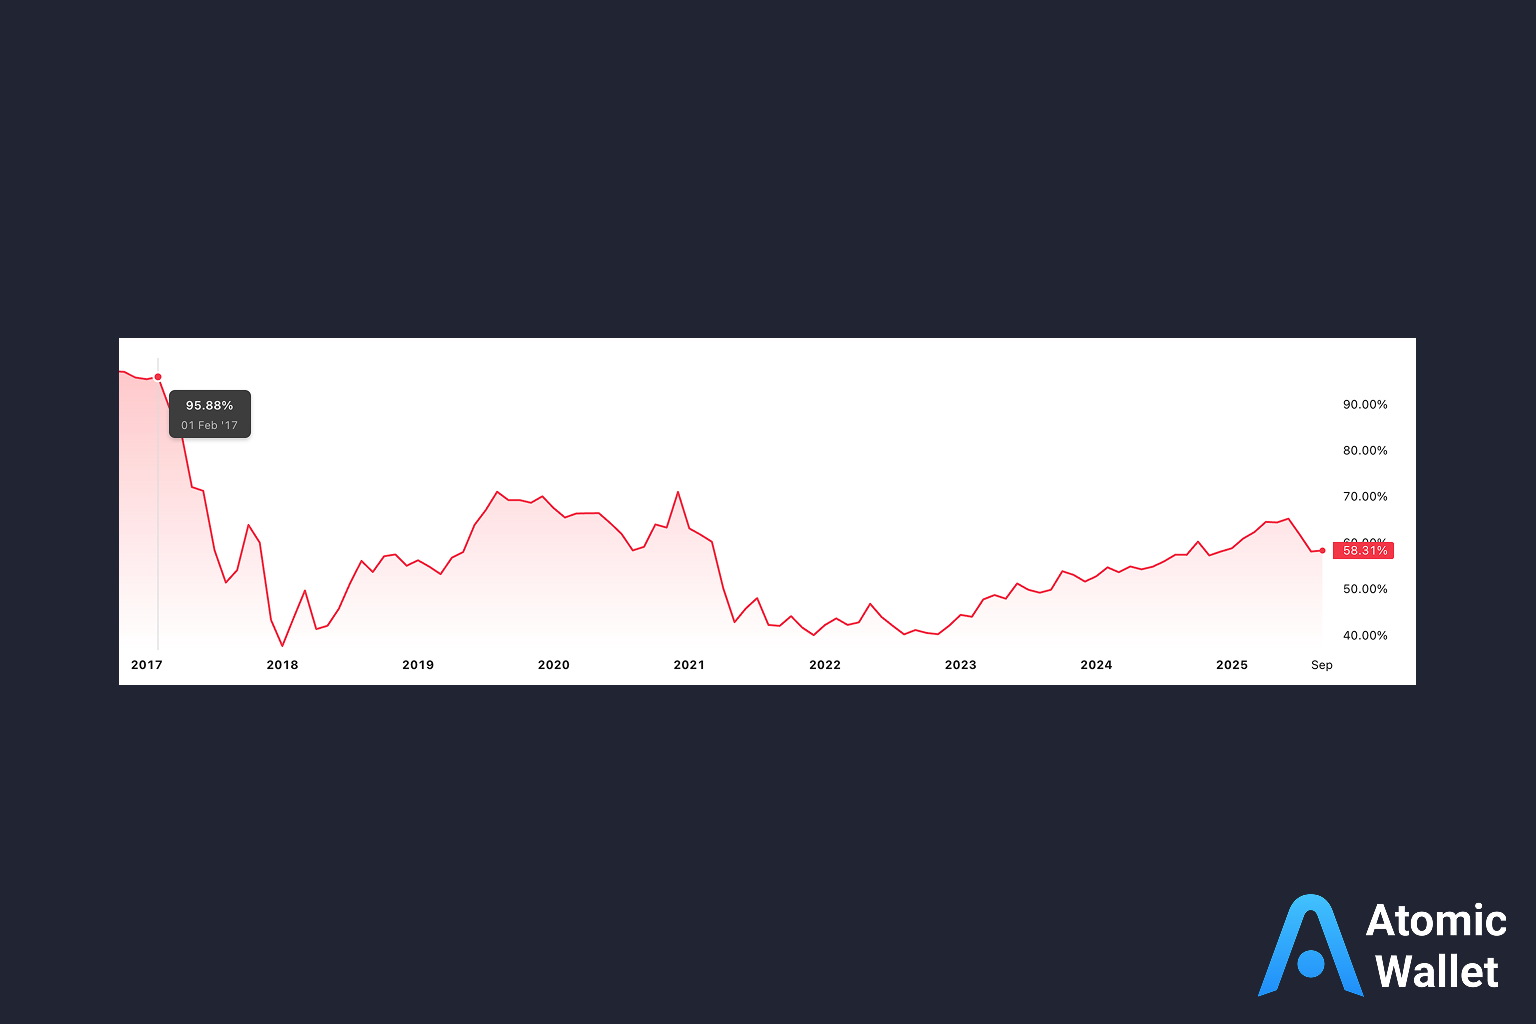
The crypto world keeps evolving, shaking up how value gets distributed in these phases. Those effects from the 2024 halving? They're still rippling through into 2025, sparking more chatter about alt surges. Right now, Bitcoin holds about 58% of the total market, down a bit from earlier this year. When that number dips, it often opens the door for other coins to shine as cash moves around.
Spotting these patterns lets you ride the wave of growth in the alt space, where the combined value is hitting around $1.7 trillion amid fresh hype. Sites with real-time trackers keep you updated on the vibe, and things like halving cycles hint at what's coming. Especially now, with big money from institutions shaking things up, staying on top of this stuff is key.
What Is Altcoin Season?
It's basically those stretches where alts rack up bigger gains than Bitcoin over a set period.
In short, most coins outside BTC start outpacing it big time. Bitcoin might flatline or dip first, shifting focus to players like Solana, DeFi projects, or meme stuff.
Alts cover a huge range, from solid utility tokens to risky bets. You see wild multipliers, like 10x or even 50x, fueled by buzz, new tech, or just money rotating in. Think back to Chainlink leading the charge in past runs, getting everyone fired up.
Signs include Bitcoin's share shrinking, more trading volume in alts, and shifts in market mood via fear-greed tools. These seasons can last weeks or drag on for months, usually kicking off after BTC peaks. With 2025's twists, keeping tabs helps dodge the bumps and grab opportunities.
Quick Definition: It counts as altcoin season if 75% of the top 50 coins (skipping stables and wrapped ones like WBTC, stETH, cLINK) beat Bitcoin over 90 days, per standard indexes.
The Role of Bitcoin Dominance in Altcoin Season
Dominance charts show Bitcoin's slice of the whole crypto pie, and they can tip you off to when alts might rev up or wind down.
BTC.D measures Bitcoin's chunk of the total value. When it drops, that's often a heads-up for alts to take off as funds flow elsewhere. History shows dips below 50% leading to massive alt rallies.
As of today, it's hovering around 58%, in a kind of cooldown mode with more buys tilting toward alts. Post-halving patterns match up, like sell-offs clearing the way for fresh action.
You can pull up these charts on TradingView to spot trends. Steady drops in BTC.D, plus rising alt volume? That's your cue to get involved. If it climbs back, Bitcoin's probably reclaiming the throne. Pairing these percentages with other signals nails down those shifts pretty well.
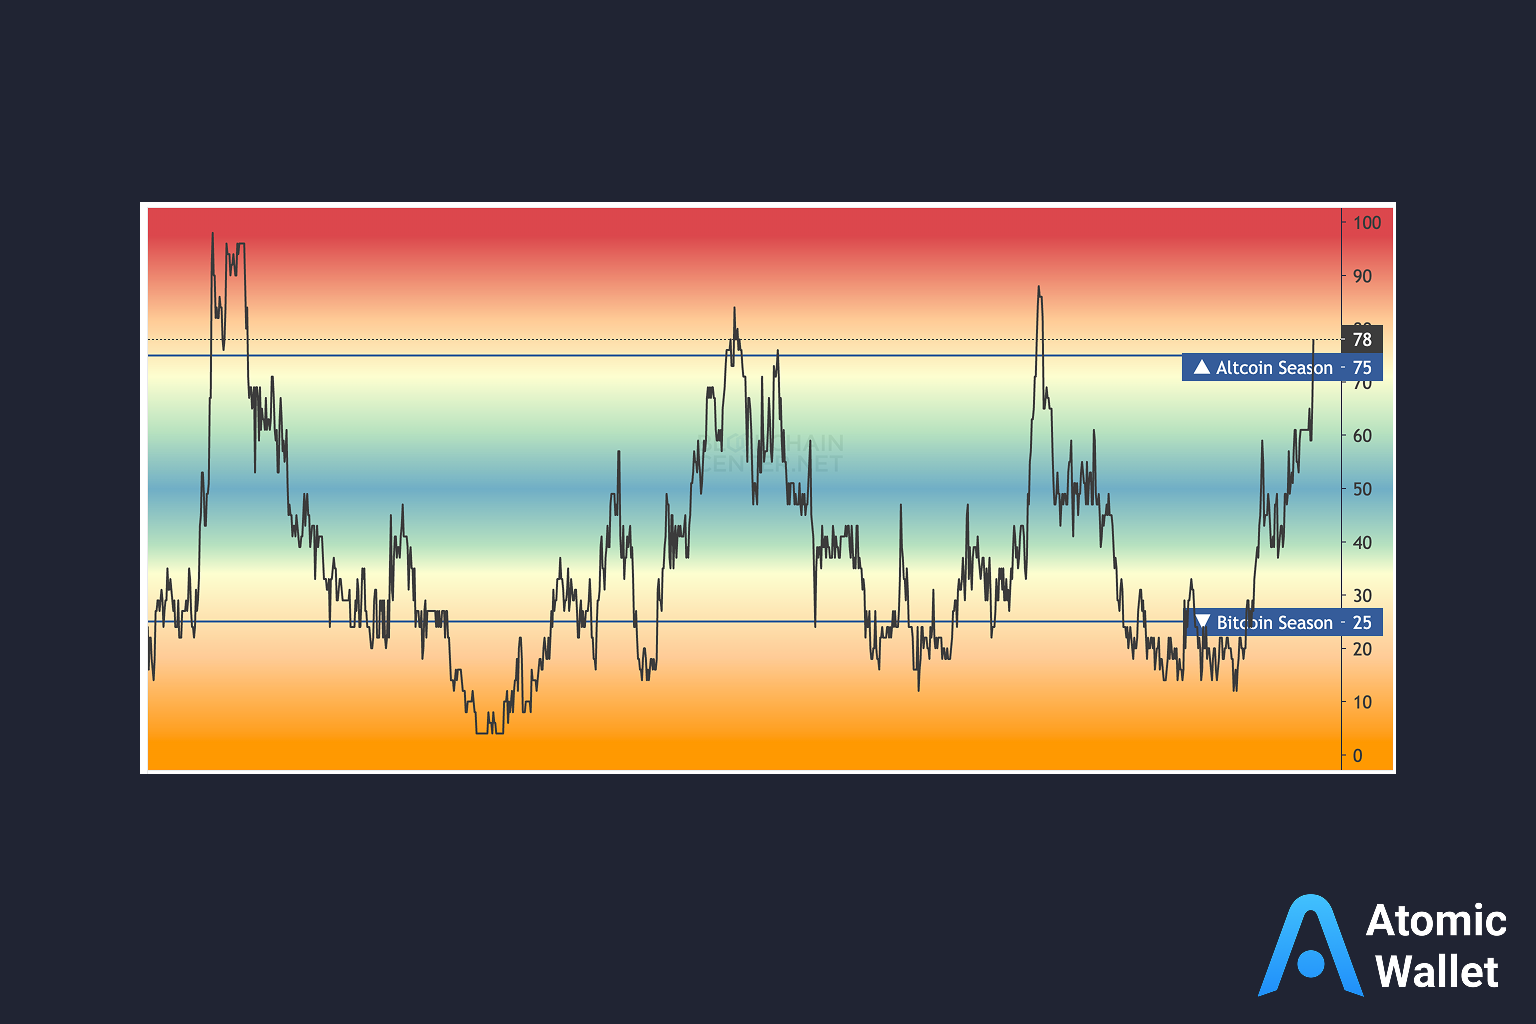
Understanding the Altcoin Season Index
This tool scans the top 100 coins to gauge if alts are ruling the roost right now.
Places like Blockchain Center run it, scoring on a scale where 75+ means alt dominance. It checks if 75% of the top 50 (minus stables and backed tokens) topped Bitcoin in 90 days.
Today's reading? Right now, the index sits at 78, indicating that altcoins are currently holding sway over the scene. Observers often track these transitions closely, noting that typical altcoin seasons last around 18 days on average, though historical data shows they can extend as long as 117 days in some cases.
How to Use Key Market Indicators to Identify Altcoin Season
Stuff like dominance levels, the index, and fear-greed meters help predict when it's coming.
Here's a simple rundown:
- Keep tabs on Bitcoin dominance via CoinMarketCap or TradingView. Below 60%? Could mean alts are gearing up.
- Check the index at blockchaincenter.net. Over 75 confirms it. Right now, it's at 78.
- Peek at fear and greed. Scores above 70 fuel the hype; today's at ~50, neutral territory.
- Use the Bitcoin rainbow chart. In the good zones? Room for alts to rotate in.
- Scan liquidity maps. Those clear-out spots hint at big moves ahead.
Mix dominance falls with index climbs for solid calls.
Historical Trends and the Impact of Bitcoin Halving
Past cycles tie halving events to liquidity shifts that spark alt seasons and fund moves.
Halvings hit every four years, kicking off chains of events. The 2024 one boosted BTC first, then alts followed in 6-12 months. After 2020, 2021 saw plateaus letting alts explode.
Dominance tanked in 2017-2018, paving the way for broad gains. Charts reveal these post-halving clusters channeling cash.
Conclusion
Alternative seasons generate cryptocurrency prospects, directed by dominance variations and metrics. Proficiency with elements like season index and rainbow depictions supports foresight. 2025 progressions inclining toward alternatives necessitate attentiveness.